
Shrimp Feed Management: How to Improve FCR and Reduce Feed Cost
1/10/2026
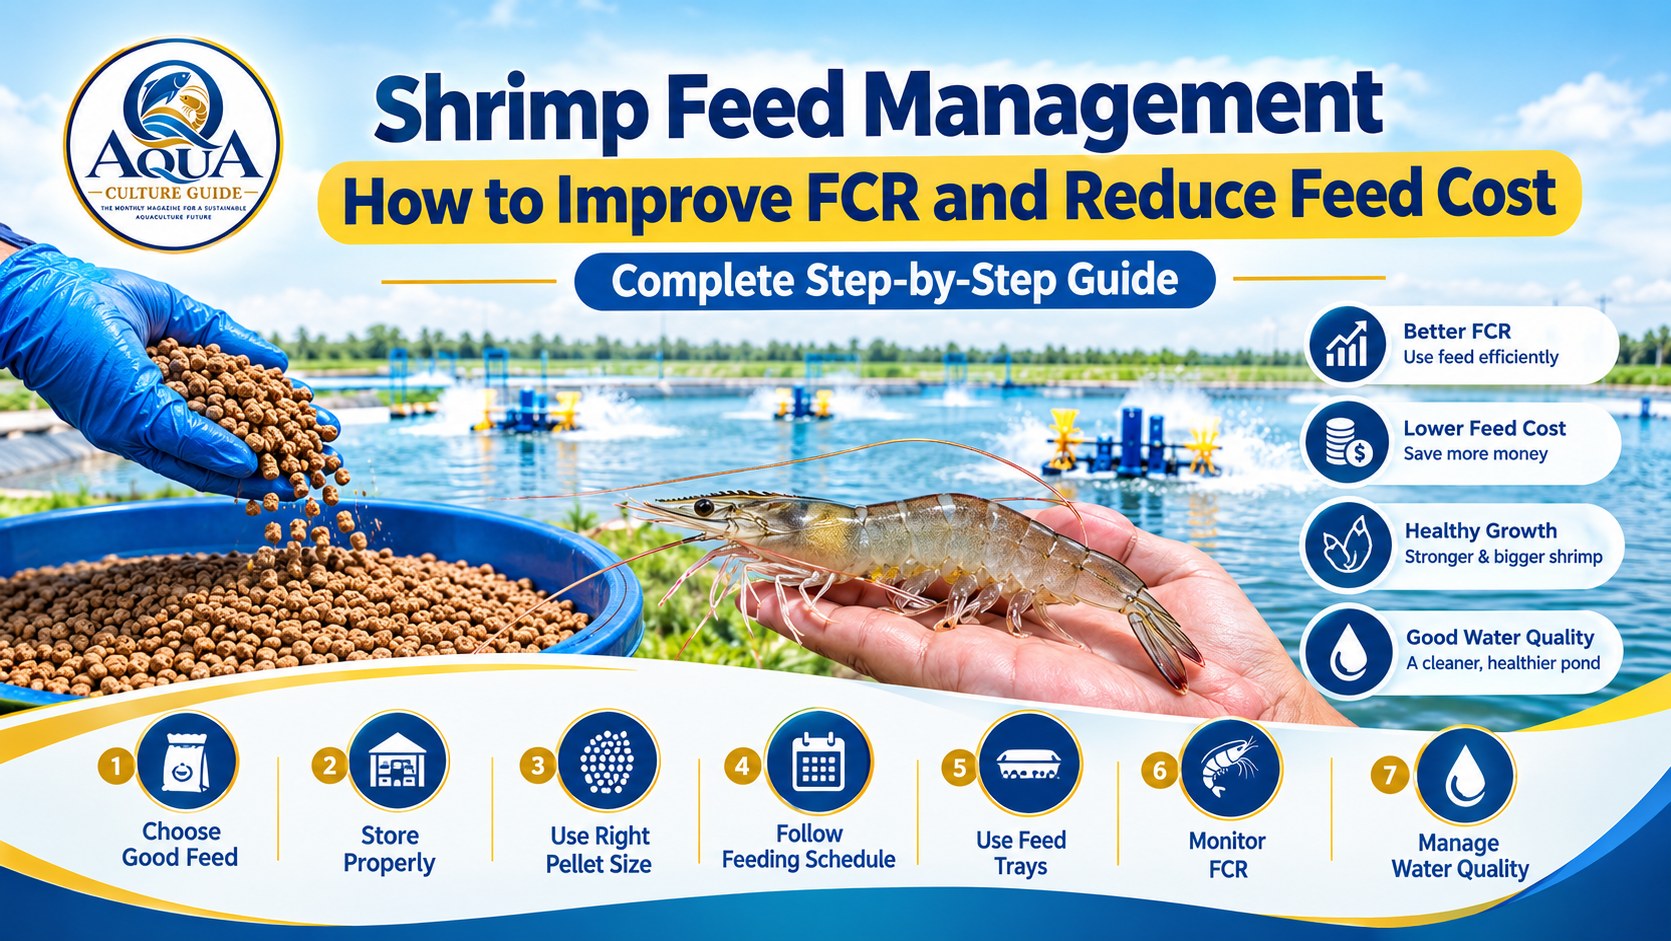
Learn how to manage shrimp feed, improve FCR and reduce feed cost with practical tips on feeding schedules, feed trays, sampling, feed adjustment, storage and water-quality management.
Shrimp Feed Management: How to Improve FCR and Reduce Feed Cost
Feed management is one of the most important parts of successful vannamei shrimp farming.
Feed is also a major operating expense. MPEDA states that feed can account for around 50–60% of operating costs, which means even a small improvement in feed efficiency can have a significant effect on farm economics.
The goal is to provide:
The right feed + the right quantity + the right timing + the right distribution + regular monitoring
When feed management is poor, uneaten feed can increase organic loading and contribute to water-quality problems. When feeding is too low, shrimp growth can suffer.
What Is FCR in Shrimp Farming?
FCR stands for Feed Conversion Ratio.
It indicates how much feed is used in relation to the shrimp biomass produced.
Basic formula
FCR = Total feed used ÷ Total shrimp biomass produced
For example:
If a farm uses 12,000 kg of feed and harvests 10,000 kg of shrimp:
FCR = 12,000 ÷ 10,000
FCR = 1.20
So the farm has an FCR of 1.20.
Why Is FCR Important?
FCR directly affects feed expenditure.
Consider a simple example:
Shrimp production = 10,000 kg
At FCR 1.20
10,000 × 1.20 = 12,000 kg feed
At FCR 1.50
10,000 × 1.50 = 15,000 kg feed
Difference:
3,000 kg feed
If feed costs ₹100/kg, the difference would be:
3,000 × ₹100 = ₹3,00,000
This is only an illustration. Actual feed prices and farm performance vary.
The example shows why controlling feed waste can have a meaningful financial impact.
Select a Good-Quality Feed
Start with a feed appropriate for the species, shrimp size and farming system.
When buying feed, check:
Feed type and pellet size
Manufacture date
>Batch number
Packaging condition
Storage condition
Suitability for the shrimp size
Store Shrimp Feed Properly
Good feed can lose quality when it is stored badly.
Feed-storage checklist
☐ Keep bags on pallets
☐ Protect from rain and moisture
☐ Avoid direct sunlight
☐ Maintain ventilation
☐ Keep the store clean
☐ Control rodents
☐ Keep chemicals and fuel away from feed
☐ Follow first-in, first-out stock rotation
Do not allow feed bags to remain directly on a damp floor.
Choose the Correct Feed Size
Shrimp feed should match the size and developmental stage of the shrimp.
Using a pellet that is too large can reduce feed consumption and increase waste.
Using feed that is too small can make distribution less efficient.
Follow the feed manufacturer's recommendations as a starting point, then adjust the feeding program based on actual shrimp response, sampling and feed-tray observations.
Establish a Feeding Schedule
Shrimp feeding should follow a planned schedule rather than random feeding
Feeding frequency should depend on:
Shrimp size
Biomass
Pond conditions
Feed type
Feeding response
Water quality
Farm feeding system
Feed According to Shrimp Biomass
One of the biggest mistakes in shrimp farming is treating a feeding chart as a fixed number throughout the crop.
The required feed changes as shrimp grow.
Basic approach
Estimated biomass → feeding rate → daily feed quantity
Use Feed Trays
Feed trays are one of the most useful tools for controlling feed waste.
MPEDA recommends installing feed trays after about 10 days of stocking and monitoring feeding from around the 20th day onward.
A tray allows the farmer to observe whether feed is being consumed.
If feed is completely consumed
The feeding quantity may need to be reviewed upward, depending on the overall feeding response.
If significant feed remains
The feeding quantity should generally be reduced and the reason investigated.
**Do Not Judge Feeding From One Tray Alone
**
A common mistake is to put one tray in the pond and assume it represents every shrimp.
Shrimp distribution can vary throughout a pond.
Use:
Properly positioned trays
Multiple observation points where appropriate
Regular cast-net or sampling methods
Shrimp behavior
Water quality
Pond-bottom condition
Spread Feed Properly
Feed distribution is just as important as feed quantity.
During the early culture period, MPEDA recommends spreading feed within roughly 2–4 metres of the pond edge
Avoid repeatedly feeding in:
Black-bottom areas
Bad-smelling areas
Sludge accumulation zones
Corners where feed is likely to accumulate
Sample Shrimp Regularly
Regular sampling is essential for good feed management.
MPEDA recommends weekly shrimp sampling after around 45 days to assess growth and calculate FCR.
Measure:
Average body weight
Size distribution
Estimated survival
Biomass
Feed consumption
FCR
Calculate Feed Requirement
Once estimated biomass is available, a feeding program can be developed.
For example:
Estimated biomass = 3,000 kg
Suppose the farm's current feeding program calls for a 3% daily ration as an example:
3,000 × 3%
= 90 kg feed/day
Adjust Feed Based on Pond Conditions
Feed consumption can change when shrimp are stressed.
MPEDA recommends reducing feeding during periods including:
Low dissolved oxygen
Plankton crash
Rainfall
Molting
Extreme temperature
Disease outbreaks
This is an important principle:
Do not continue feeding the same quantity when pond conditions have suddenly changed.
Instead:
Check the problem → assess shrimp behavior → observe feeding response → adjust feed appropriately
Watch Dissolved Oxygen
Dissolved oxygen is closely linked with feeding activity.
Important
Never reduce aeration just to make feeding easier if doing so puts shrimp at risk.
Aeration and feeding schedules should be coordinated according to pond biomass, DO levels and the farm's aeration plan
Watch the Pond Bottom
Feed that reaches the bottom but is not consumed becomes part of the pond's organic load.
Regularly inspect the feeding area.
Look for:
Black soil
Bad odor
Accumulated organic matter
Benthic algae
Uneaten feed
Simple rule
Poor pond bottom → investigate feed quantity first
Avoid Overfeeding
Overfeeding is one of the easiest ways to increase feed costs.
Suppose you are giving an extra:
5 kg feed/day
Over 100 days:
5 × 100 = 500 kg extra feed
At ₹100/kg:
500 × ₹100 = ₹50,000
Again, this is an illustration
**Avoid Underfeeding Too
**
Reducing feed aggressively is not automatically good management.
If the crop is genuinely consuming the available feed and growing well, excessive feed restriction may affect growth.
The objective is not:
"Use the least feed possible."
The objective is:
"Use the amount of feed required for healthy growth with minimum waste."
Manage Feeding During Molting
During molting, feeding behavior can change.
MPEDA recommends reducing feeding during molting periods when appropriate.
Farmers should observe:
Feeding response
Soft-shell shrimp
Reduced activity
Feed-tray response
Water quality
Rather than making large automatic changes, adjust feeding based on actual observations.
Adjust Feeding After Heavy Rain
Rainfall can cause rapid changes in:
Salinity
Temperature
pH
Water stratification
Shrimp behavior
After significant rainfall:
Check water quality → observe shrimp → check feeding response → adjust accordingly
Monitor FCR Throughout the Crop
Do not calculate FCR only after harvest.
Track it periodically.
Cumulative FCR formula
Cumulative FCR = Cumulative feed used ÷ Estimated shrimp biomass gain
Compare Feed Intake With Growth
Suppose two weeks of feeding records show:
Week Feed Used Estimated Biomass Gain
Week 1 1,000 kg 800 kg
Week 2 1,200 kg 1,000 kg
The simple feed-to-gain ratios would be:
Week 1:
1,000 ÷ 800 = 1.25
Week 2:
1,200 ÷ 1,000 = 1.20
The second week shows better feed efficiency based on those estimates.
Keep a Daily Feed Register
Every feeding should be recorded.
| Date | Pond | Feeding Time | Feed Given | Tray Response | Remarks |
|---|---|---|---|---|---|
| Day 1 | Pond 1 | 8 AM | 20 kg | Good | Normal |
| Day 1 | Pond 1 | 12 PM | 20 kg | Good | Normal |
| Day 1 | Pond 1 | 5 PM | 25 kg | Good | Normal |
| Day 1 | Pond 1 | 10 PM | 30 kg | Good | Normal |
Also record:
Weather
Rainfall
DO
pH
Shrimp behavior
Mortality
Health observations
Feed adjustment
Good records make it easier to identify why FCR changes.
Manage Feed Quality Until It Reaches the Pond
Feed quality can be affected not only at the factory but also by farm handling.
Avoid:
Wet bags
Moldy feed
Damaged packaging
Long exposure to sun
Poor storage
Mixing old and fresh stock without tracking
Keeping feed beside chemicals
Practical Ways to Improve FCR
- **Use fresh, good-quality feed
**
Poor-quality or improperly stored feed can reduce feed efficiency.
- Match feed size to shrimp size
Make it easy for shrimp to consume the feed.
3. Use feed trays
Observe actual consumption rather than relying only on a chart.
- **Sample shrimp regularly
**
Update biomass and growth estimates.
5.** Control overfeeding
**
Small daily wastage can become a major cost.
- Feed according to conditions
Rain, low DO, temperature stress, molting and disease can change feed consumption.
- Maintain good water quality
Healthy shrimp generally provide a more reliable feeding response.
8. Keep feeding areas clean
Avoid feeding heavily where the pond bottom is deteriorated.
- Record everything
Use daily data to adjust feeding.
- Review FCR regularly
Do not wait until harvest to discover that feed efficiency has deteriorated.
How to Reduce Shrimp Feed Cost
Reducing feed cost does not necessarily mean buying cheaper feed.
A better approach is to reduce feed wastage and unnecessary feed consumption.
Feed-cost formula
Total feed cost = Total feed used × Feed price/kg
For example:
12,000 kg feed × ₹100/kg
= ₹12,00,000
If better management reduces unnecessary feed use by 500 kg:
500 × ₹100
= ₹50,000 saved
Actual savings depend on feed price and farm performance.
**Cheap Feed vs Efficient Feed
**
A lower-priced feed is not necessarily cheaper overall.
Consider:
Feed A
Price = ₹95/kg
FCR = 1.60
Feed B
Price = ₹105/kg
FCR = 1.30
Illustrative feed cost per kg of shrimp produced:
Feed A: ₹95 × 1.60 = ₹152/kg shrimp
Feed B: ₹105 × 1.30 = ₹136.50/kg shrimp
**What Is a Good FCR for Vannamei?
**
There is no single FCR that applies to every farm.
FCR depends on:
Feed quality
Shrimp size
Survival
Stocking density
Natural pond productivity
Water quality
Feed management
Sampling accuracy
Culture system
Feed Management During Disease Problems
When shrimp show abnormal behavior, reduced feeding or mortality, do not continue the same feeding program blindly.
Start with:
Observe → Test water → Check shrimp → Review feed response → Investigate disease risk → Adjust feeding
Common Shrimp Feeding Mistakes
Feeding by guesswork
A feeding chart is a starting point, not a substitute for observation.
Ignoring feed-tray response
Uneaten feed is a warning sign that needs investigation.
Increasing feed after every good tray observation
One good feeding result does not automatically justify a large increase.
Ignoring water quality
Shrimp may consume less feed when stressed.
Feeding in dirty areas
Organic-rich pond-bottom areas should be avoided.
Using old feed
Feed quality declines with poor storage and prolonged storage.
Adding unnecessary feed additives
Fresh, quality feed does not automatically need additional ingredients.
Not recording feed
Without records, FCR cannot be evaluated properly.
Daily Shrimp Feed Management Checklist
Before feeding
☐ Check DO
☐ Observe shrimp activity
☐ Check recent weather/rainfall
☐ Review previous feeding response
☐ Inspect water quality
During feeding
☐ Use the correct pellet size
☐ Distribute feed evenly
☐ Avoid dirty pond-bottom areas
☐ Observe feeding trays
☐ Record feed quantity
After feeding
☐ Check tray response
☐ Look for excessive uneaten feed
☐ Review shrimp behavior
☐ Adjust the next ration when necessary
Weekly
☐ Sample shrimp
☐ Estimate biomass
☐ Review growth
☐ Calculate/update FCR
☐ Review cumulative feed use
☐ Check pond-bottom condition
**Simple FCR Example for Farmers
Suppose:**
Total feed used: 15,000 kg
Harvested shrimp: 12,000 kg
Then:
FCR = 15,000 ÷ 12,000
FCR = 1.25
Now suppose the farm produced the same 12,000 kg using only 13,200 kg feed:
13,200 ÷ 12,000 = 1.10
Difference in feed:
15,000 − 13,200 = 1,800 kg
This demonstrates how improving feeding efficiency can reduce feed usage without necessarily requiring an increase in production.
A Simple Formula for Your Aqua Culture Guide Website
This article would work very well with an online Shrimp FCR Calculator.
Inputs
Total Feed Used: ____ kg
Shrimp Production: ____ kg
Output
FCR = Total Feed ÷ Shrimp Production
Example
Feed = 10,000 kg
Production = 8,000 kg
FCR = 1.25
You can also add a second calculator:
Feed Cost Calculator
Feed Quantity × Feed Price = Total Feed Cost
And a third:
Daily Feed Calculator
Estimated Biomass × Feeding Rate (%) = Daily Feed Requirement
Conclusion
Good shrimp feed management is about efficiency, not simply reducing feed.
The farmer's goal should be to provide enough feed for healthy shrimp growth while minimizing uneaten feed and unnecessary expenditure.
The most important practices are:
Use good-quality feed → store it properly → match feed to shrimp size → distribute it correctly → use feed trays → sample shrimp regularly → monitor water quality → adjust feeding when conditions change → calculate FCR → maintain accurate records.
Questions & Answers
Q1.What is FCR in shrimp farming?
FCR is the amount of feed used relative to the shrimp biomass produced. The basic formula is: FCR = Total feed used ÷ Shrimp biomass produced
Q2.How can I reduce feed cost in shrimp farming?
Focus on feed quality, accurate biomass estimation, feed trays, proper distribution, regular sampling, water-quality management and avoiding overfeeding.
Q3.How often should shrimp be sampled?
MPEDA recommends regular sampling and specifically advises weekly sampling after approximately 45 days for growth assessment and FCR calculation
Q4.When should feeding be reduced?
Feeding may need to be reduced during low DO, heavy rainfall, plankton crashes, extreme temperatures, molting periods and disease outbreaks, depending on the actual pond condition
Q5.What FCR should a vannamei farmer target
There is no universal target. MPEDA's 2024 article cited 1.2 as a best FCR estimate, while FAO's species overview reports roughly 1.2–1.8:1 in the systems it discusses. Actual farm FCR depends on the production system and how biomass and feed use are measured.
Related articles
భారతీయ రిజర్వాయర్లలో కేజ్ ఫిష్ ఫార్మింగ్: సాంకేతికత, అనుమతులు మరియు పెట్టుబడి వివరాలు
భారతదేశంలోని రిజర్వాయర్లలో కేజ్ ఫిష్ ఫార్మింగ్ ఎలా ప్రారంభించాలి? అవసరమైన సాంకేతికత, ప్రభుత్వ అనుమతులు, పెట్టుబడి, చేపల జాతులు, మేత నిర్వహణ మరియు లాభనష్టాల గురించి పూర్తి వివరాలు తెలుసుకోండి.
Freshwater Prawn Farming in IndiaFreshwater Prawn Farming in India: రైతులకు పూర్తి సాగు మార్గదర్శిని
భారతదేశంలో మంచినీటి రొయ్యల సాగు ఎలా ప్రారంభించాలి? జెయింట్ ఫ్రెష్వాటర్ ప్రాన్ సీడ్ ఎంపిక, చెరువు తయారీ, స్టాకింగ్, ఆహారం, నీటి నాణ్యత, పెట్టుబడి, మార్కెటింగ్ గురించి పూర్తి వివరాలు తెలుసుకోండి.
Tilapia farming in Indiaభారతదేశంలో తిలాపియా చేపల పెంపకం – మార్కెట్ అవకాశాలు, ప్రభుత్వ నిబంధనలు మరియు ఆధునిక సాగు పద్ధతులు
భారతదేశంలో తిలాపియా చేపల పెంపకం ఎలా చేయాలి? మార్కెట్ అవకాశాలు, ప్రభుత్వ అనుమతులు, చెరువు సాగు, బయోఫ్లాక్, RAS విధానాలు, పిల్లల ఎంపిక, మేత నిర్వహణ మరియు దిగుబడి గురించి పూర్తి సమాచారం.
PCR Testing in Shrimp Hatcheriesరొయ్యల హ్యాచరీల్లో PCR పరీక్షలు: ఫలితాలను రైతులు ఎలా అర్థం చేసుకోవాలి?
WSSV, EHP, AHPND వంటి వ్యాధికారకాలను గుర్తించడంలో PCR పరీక్షల పాత్ర, పరీక్షా నివేదికలను అర్థం చేసుకోవడం, నాణ్యమైన రొయ్య పిల్లలను ఎంపిక చేసుకోవడం గురించి రైతులు తెలుసుకోవాల్సిన పూర్తి సమాచారం.
Explore Aqua Culture Guide
Aqua companies directory
Feed, seed, probiotics & equipment suppliers
Aquaculture calculators
Feed, FCR, stocking & water quality tools
Telugu aqua magazine
Read the latest monthly issue online
All aqua news & articles
Farming, disease control and market updates
List your company free
Get found by farmers across India
Advertise with us
Magazine and website advertising options